 AnyChart JS Charts and Dashboards v.8.7.0
Advertisement
Description
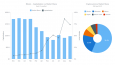
AnyChart is a robust and superfast JavaScript charting library to add great-looking, interactive HTML5 charts into any project, in any browser, and on any platform/OS including mobile ones.
AnyChart provides advanced customization and flexibility opportunities, no matter if you are developing a website, a business intelligence application (BI) for corporate usage, or some software for your clients. Our JavaScript API makes it...
Read more
- Rate:
- Release Date:08/07/2019
- License:Shareware
- Category:Web Programming
- Developer:AnyChart JavaScript Charts
- Downloads:632
- Size:17.81 Mb
- Price: $49.00
To free download a trial version of AnyChart JS Charts and Dashboards, click here
To buy software AnyChart JS Charts and Dashboards, click here
To visit developer homepage of AnyChart JS Charts and Dashboards, click here
Advertisement
Versions History
| Version | Date Released | Release Notes |
| 8.7.0 | 07.08.2019 | Client-Side Export is now available in the AnyChart JavaScript charting library. This will allow you to have your data visualizations saved as images — SVG, PNG, and JPG — and PDF documents without a roundtrip to the server by leveraging the built-in browser features for a seamless JS chart export. |
| 8.6.0 | 14.05.2019 | 1. Timeline chart. Displays events in chronological order. A long bar labelled with dates paralleling it, and usually contemporaneous events. 2. Network graph. Visualizes how entities are interconnected. Entities are displayed as nodes (points). Relationships (edges) are shown as lines. 3. Much more |
| 8.4.0 | 05.10.2018 | JavaScript/HTML5 charts new feature: Sankey Diagram. Improved: Performance. Legend rendering. Line markers of axes now can dispatch mouse events. Now fill of 3D Pie chart can be transparent. Added contextMenu() method to anychart.ui.table class. Now gradient fill can be set as a string. Bug fixes. |
| 7.14.0 | 30.05.2017 | New JavaScript chart types out of the box: Bar Mekko, Mekko, Quadrant, Stacked Stock, Tag Cloud, Venn, and Waterfall charts. Marquee Select and Zoom tools, can be integrated into any custom UI via events. Dedicated Google Spreadsheets data loader. Scale synchronization in combined charts. Text wrap. |
| 7.13.0 | 28.02.2017 | Opened source code, issue tracker, build scripts, and list of branches. Plugins for AngularJS, React, Ember.js, Meteor, Node.js, jQuery. Sharing on social networks. Vertical, Pareto, Step Line Backward/Forward, Stick, Jump Line charts. Customs series drawing. New legend customization options. |
| 7.8.0 | 03.11.2015 | * Heat Map JS charts * Zoom & Scroll for charts * String, Date/Time, Number text formatting helper functions * Improved structure of event objects in Point listeners * defaultSeriesType, id, addSeries, removeAllSeries, getSeries, getSeriesAt, removeSeries, removeSeriesAt, getSeriesCount methods |
Screen Shot
Click on a thumbnail for the larger image.

System Requirements
AnyChart JS Charts and Dashboards requires WinXP, Win7 x32, Win7 x64, Windows 8, Windows 10, WinServer, WinOther, WinVista, WinVista x64, Linux, Linux Console, Linux Gnome, Linux GPL, Linux Open Source, Mac OS X, Android, iPhone, iPad, iOS.
AnyChart JS Charts and Dashboards v.8.7.0 Copyright
Shareware Junction periodically updates pricing and software information of AnyChart JS Charts and Dashboards v.8.7.0 full version from the publisher using pad file and submit from users. Software piracy is theft, Using crack, password, serial numbers, registration codes, key generators, cd key, hacks is illegal and prevent future development of AnyChart JS Charts and Dashboards v.8.7.0 Edition. Download links are directly from our publisher sites. Links AnyChart JS Charts and Dashboards v.8.7.0 from Bittorrent, mediafire.com, uploadfiles.com, hotfiles.com rapidshare.com, megaupload.com, netload.in, storage.to, depositfiles.com and other files hosting are not allowed. The download file is obtained directly from the publisher, not from any Peer to Peer file sharing applications such as Shareaza, Limewire, Kazaa, Imesh, eDonkey, eMule, Ares, BearShare, Overnet, Morpheus, BitTorrent Azureus and WinMX.
Review This Software
More AnyChart JS Charts and Dashboards Software
Advertisement
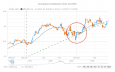
AnyStock Stock and Financial JS Charts v.8.7.0
AnyStock Stock and Financial JS Charts is a flexible JavaScript charting library to visualizing large data sets in interactive HTML5 charts. Designed to display date/time information it offers various chart types, drawing tools, technical indicators.
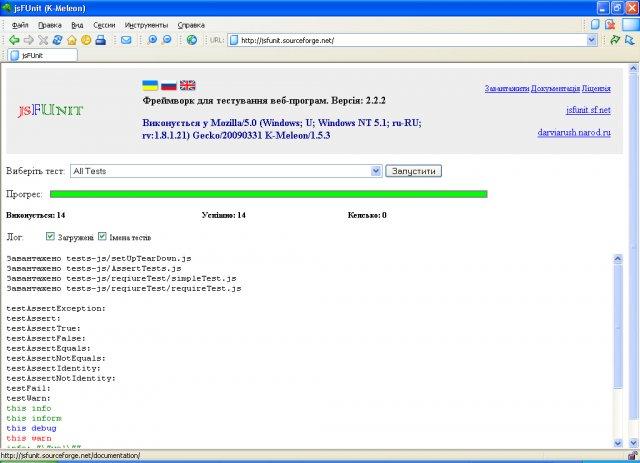
Js functional and unit testing framework v.2.3.0
JsFUnit is a Functional and Unit Testing framework for client-side (in-browser) JavaScript.

AnyMap JS Maps v.8.7.0
AnyMap JS Maps is an advanced JavaScript-HTML5 mapping library with the ever-expanding Map Collection, which makes you able to easily create interactive maps looking great on PCs, Macs, iPhones, iPads, Androids and other devices. Highly customizable.
Animated Chart v.2.2.1
Flash charts made easy. Software for generating animated interactive Flash charts and graphs for publishing to websites. Making graphs with Animated Chart is simple and quick and doesn't require any special knowledge of Flash or HTML.
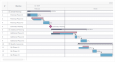
AnyGantt JS Gantt Charts v.8.7.0
AnyGantt is a flexible, cross-platform and cross-browser JavaScript charting library that allows you to easily build smart HTML5 Gantt Charts and utilize the power of animation and ultimate interactivity to facilitate project and resource management.
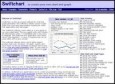
Swiftchart: chart and graph java application v1_60 v.1.0
Chart java applet software to generate dynamic charts and graphs within JSP, servlets or java applications - bar, line, pie, stacked and grouped charts in 2D and 3D with a wide range of parameters and chart types. Main features: Charts in 2D/3D,
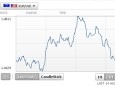
Live Forex Charts
Free, simple and powerful live forex charts software provides traders with comprehensive view of the online trading charts and access to currency rate movements. Real-time fx and currency charts with technical indicators and many online forex trading
Check Out Our Java Applications and Make Your Own 3d Piecharts!
If you are looking to make 3d Piecharts, Wyka-Warzecha has a phenomenal choice of Java applications for you to choose from. Perhaps you have a presentation coming up or you need to update your website? Well, whatever you need charts and graphs fo,r these
RadarCube WPF OLAP Grid and Chart v.1.30.0
A set of WPF controls (OLAP Grid and OLAP Chart) to add OLAP and Visual Analysis functionality to your WPF applications. OLAP Grid displays data in an interactive pivot table and OLAP Chart shows the same data in charts and graphs.
OLAP Statistics and Reporting for v.1 1
OLAP Statistics and Reporting for Access is a simple and yet powerful tool to let you configure OLAP cube from your databases, and then analyze in multi-dimensional views in grids, charts and graphs, pivoting, drill down/slice and dice and filtering.
US Mileage Charts v.2
US Mileage Charts and Tables in Excel format, including travel times and distances for both the fastest and shortest routes. Includes sets of tables for every US State, and one large pan-US chart. Total: 204 tables in 51 files. Over half a million
Other products of this developer AnyChart JavaScript Charts

AnyGantt JS Gantt Charts v.8.7.0
AnyGantt is a flexible, cross-platform and cross...y to facilitate project and resource management.

AnyMap JS Maps v.8.7.0
AnyMap JS Maps is an advanced JavaScript-HTML5 m...Androids and other devices. Highly customizable.

AnyStock Stock and Financial JS Charts v.8.7.0
AnyStock Stock and Financial JS Charts is a flex...hart types, drawing tools, technical indicators.

GraphicsJS v.1.2.0
GraphicsJS is a free, open-source JavaScript lib...ts, virtual DOM, smart layering, convenient API.